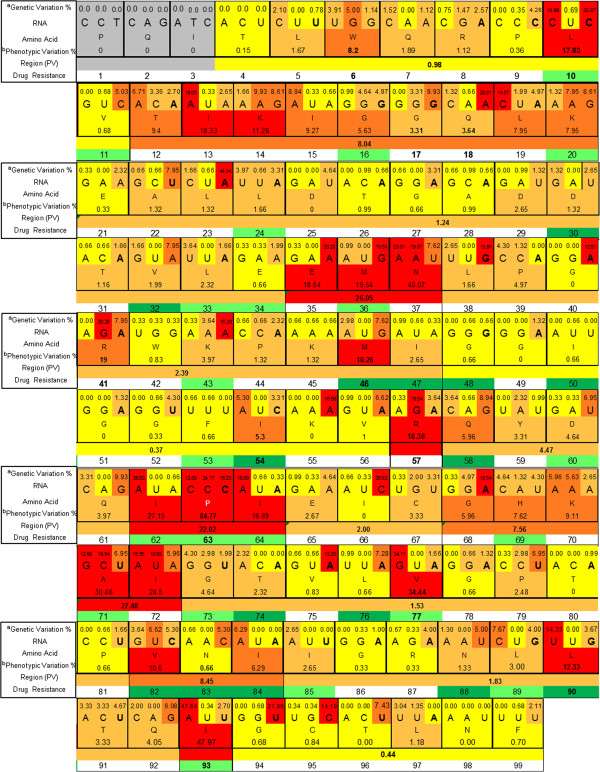
Figure 1.
Genetic and phenotypic representation of primary structure variation within the HIV-1 protease consensus. Codons 1–3 are shown in grey and were not included in our analysis. Conserved regions are shown in yellow, semi-conserved regions in ochre, variable regions in orange and highly variable regions in red. The major (dark green) and minor (light green) resistance mutations are indicated for each codon. aGenetic variation = total number of mutations at the nucleotide position/number of sequences evaluated. bPhenotypic variation = total number of mutations at the amino acid position/number of sequences evaluated.

