
Figure 1.
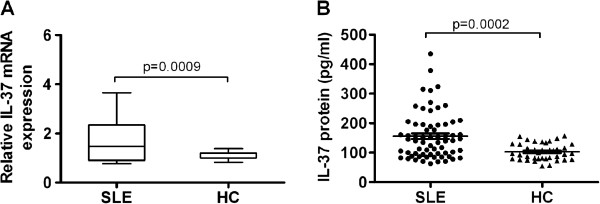
Comparison of IL-37 mRNAs and protein levels between SLE and HC. (A) Expressions of IL-37 mRNAs in PBMCs from SLE patients (n = 66) and healthy controls (HC, n = 41) were determined by RT-PCR. Results are depicted as box plots, with median (horizontal line within each box) and 10th, 25th, 75th, and 90th percentiles (bottom bar, bottom of box, top of box, and top bar, respectively). (B) Serum IL-37 protein levels in SLE patients (n = 66) and healthy controls (HC, n = 41) were determined by ELISA. Each symbol represents an individual SLE patients and healthy controls. Horizontal lines indicate median values. Mann-Whitney U-test and associated P values are indicated.