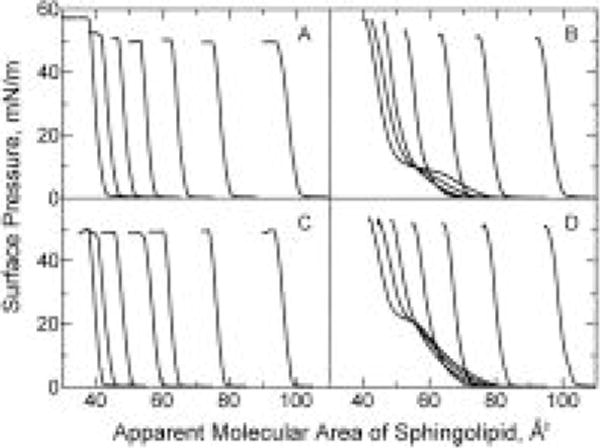
FIGURE 1.

Surface pressure vs apparent molecular area of sphingolipid. Isotherms were recorded at 24 °C on a subphase of 10 mM potassium phosphate (pH 6.6) containing 100 mM NaCl and 0.02% NaN3. In each panel, cholesterol mole fractions increase by 0.1 in the isotherms such that Xchol = 0, 0.1, 0.2, 0.3, 0.4, 0.5, and 0.6 from left to right (at π = 30 mN/m): (A) 18:0 GalCer, (B) 18:0 SM, (C) 16:0 GalCer, and (D) 16:0 SM.
