
FIGURE 2.
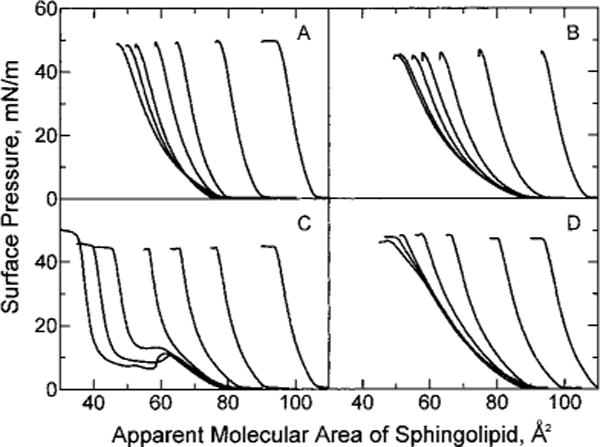
Surface pressure vs apparent molecular area of sphingolipid. Experimental conditions were the same as in Figure 1: (A) 18:1 GalCer. (B) 18:1 SM, (C) 24:1 GalCer, and (D) 24:1 SM.
Official websites use .gov
A
.gov website belongs to an official
government organization in the United States.
Secure .gov websites use HTTPS
A lock (
) or https:// means you've safely
connected to the .gov website. Share sensitive
information only on official, secure websites.
Surface pressure vs apparent molecular area of sphingolipid. Experimental conditions were the same as in Figure 1: (A) 18:1 GalCer. (B) 18:1 SM, (C) 24:1 GalCer, and (D) 24:1 SM.