
FIGURE 3.
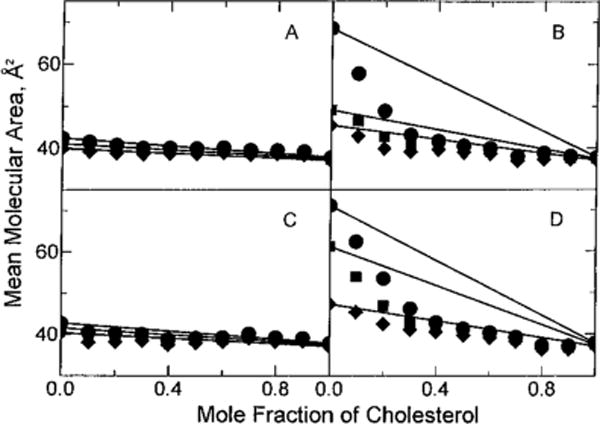
Mean molecular area vs composition: (●) 5 mN/m, (■) 15 mN/m, and (◆) 30 mN/m. Experimental points are from the isotherms shown in Figure 1 and are indicated by the symbols. Solid lines represent ideal additivity of mean molecular area at the designated surface pressure and were calculated using eq 1 in Materials and Methods: (A) 18:0 GalCer, (B) 18:0 SM, (C) 16:0 GalCer, and (D) 16:0 SM.