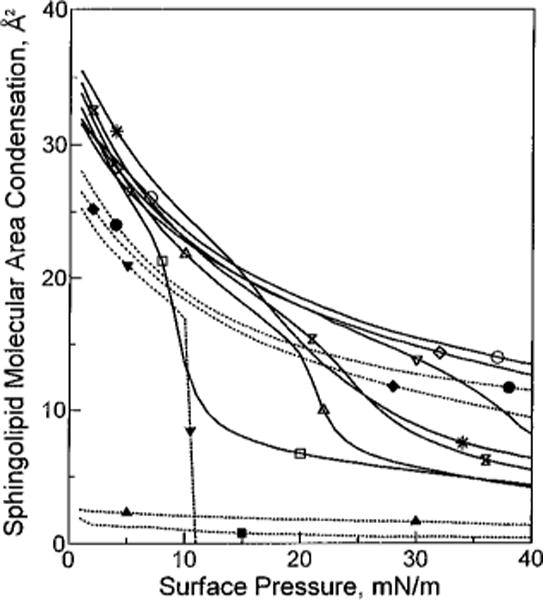
FIGURE 5.

Sphingolipid cross-sectional area condensation vs surface pressure. Each line represents the condensation observed when equimolar cholesterol is mixed with the designated sphingolipid at 24 °C. Solid lines represent different SMs. Dotted lines represent different GalCers. Area condensations were calculated as described in Materials and Methods. For each line, area condensation values were calculated at 1 mN/m intervals over the surface pressure range from 1 to 40 mN/m: (■) 18:0 GalCer, (▲) 16:0 GalCer, (▼) 24:1 GalCer, (□) 18:0 SM, (△) 16:0 SM, (bow tie) egg SM, (*) bovine SM, (◆) 18:1 GalCer, (●) 18:2 GalCer, (▽) 24:1 SM, (◇) 18:1 SM, and (○) 18:2 SM.
