
FIGURE 7.
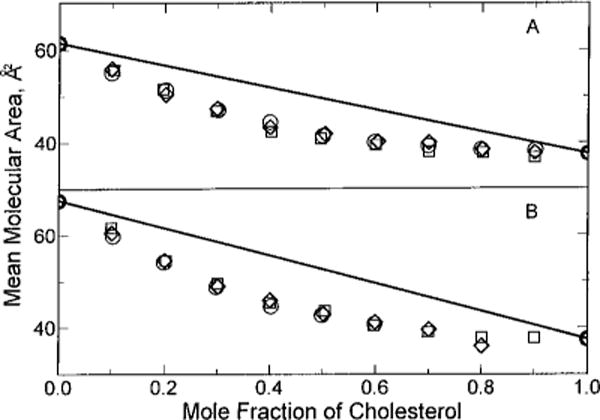
Mean molecular area vs composition. First, the surface pressure necessary to achieve identical molecular areas in the liquid-expanded state was determined for each pure lipid. Then, the effect of cholesterol on the mean molecular areas of the mixed films was compared at each pure lipid’s “area-equivalent” surface pressure. Ideal additivity is shown by the solid lines which were calculated using eq 1 in Materials and Methods. Experimental points are indicated by the symbols: (A) (○) 16:0, 18:1 PC at 30 mN/m, (□) 18:1 SM at 22.8 mN/m, and (◇) 18:1 GalCer at 14.75 mN/m; (B) (○) 16:0, 24:1 PC at 21.9 mN/m, (□) 24:1 SM at 18.1 mN/m, and (◇) 24:1 GalCer at 7 mN/m.