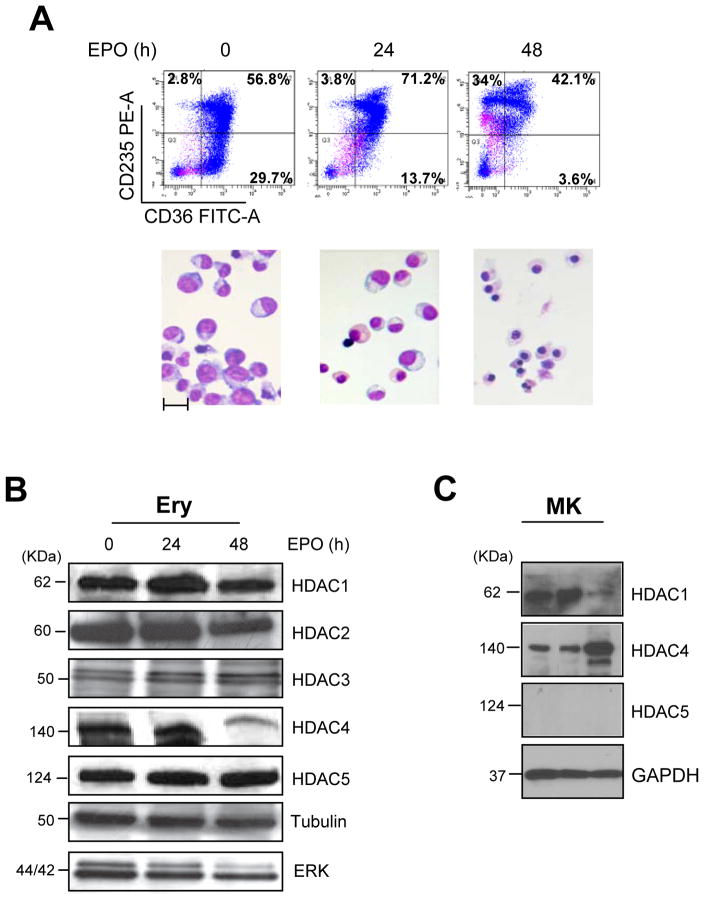
Figure 1. HDACs expression during ex-vivo maturation of human erythroblasts.
A) Characterization of the maturation state of the erythroid cells used for the study. Flow cytometry profiling for CD36/CD235a expression (top panels) and morphology (by May-Grunwald/Giemsa staining, bottom panels) of human erythroblasts induced to mature with EPO for 0, 24 and 48 h, as indicated. Original magnifications 40X. The scale bar included in the micrograph corresponds to 35 μM.
B) WB analyses of HDAC1, HDAC2, HDAC3, HDAC4 and HDAC5 contents of erythroblasts treated with EPO for 0, 24 and 48 h (the same cells presented in A). Both Tubulin and total ERK were analyzed as loading controls. Expected molecular weights are indicated on the left. Similar results were observed in three additional experiments.
C) WB analyses of HDAC1, HDAC4 and HDAC5 content of megakaryocytes (MK) expanded ex-vivo from CD34pos cells purified from three separate AB donors. The biological features of the cells are described in Varricchio et al., 2012. GAPDH was analyzed as loading control.
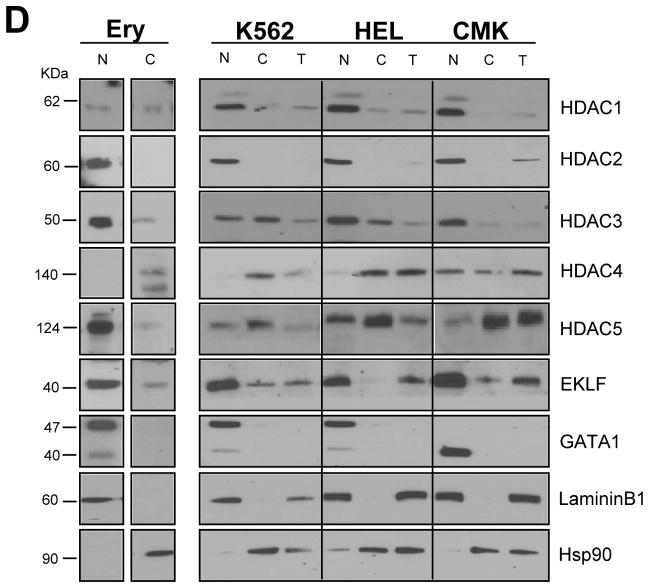
D) WB analyses with the specific antibodies indicated on the right of nuclear and cytoplasmic fractions purified from proerythroblasts expanded from CB (Ery) and from erythroid (K562 and HEL) and megakaryocytic (CMK) progenitor cell lines. In the case of the cell lines, total cell extracts (T) were also analyzed for comparison. The fact that HDAC1, HDAC2, HDAC3 and GATA1 were readily detectable in nuclear extracts but not in total cell extracts of the three cell lines likely reflects the low abundance of these proteins in these cells. Laminin B and HSP90 were analyzed as loading and contamination control. Expected molecular weights are indicated on the left.


