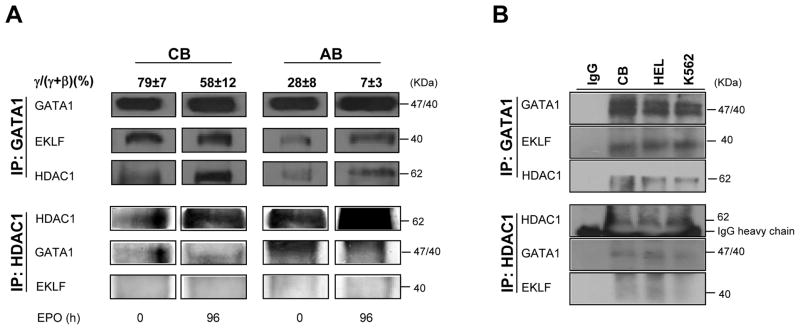
Figure 2. In human erythroblasts, GATA1 is associated both with HDAC1 and EKLF.

A) WB analyses with antibodies against GATA1, EKLF and HDAC1 of IP obtained with antibodies against GATA1 (top panels) and HDAC1 (bottom panels) of total cell lysates from erythroblasts from cord blood (CB) or adult blood (AB) induced to mature with EPO for 0 and 96 h, as indicated. The γ/(γ+β) expression ratios (in percent, mean±SD) expressed by the cells are indicated on the top. Similar results were obtained in six additional experiments, three with cells expanded from separate CB donors and three with cells expanded from separate AB donors.
B) WB analyses of GATA1 (top panel) and HDAC1 (bottom panel) IPs of total cell lysates from eythroblasts expanded from CB and of HEL and K562 cell lines. IP with IgG were used as negative controls.
