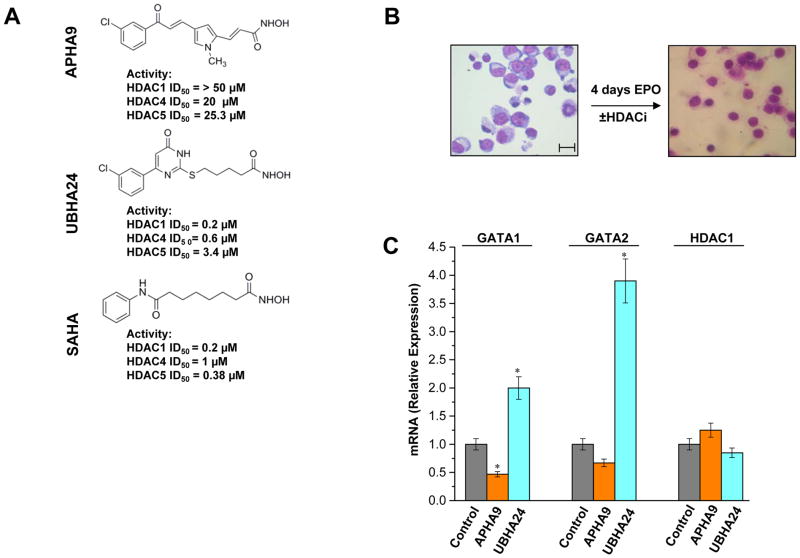
Figure 5. Pharmacological inhibition of class II and pan-HDACs does not affect erythroid maturation and HDAC1 mRNA expression.
A) Molecular structure and in vitro ID50 on HDAC1, HDAC4 and HDAC5 purified from human erythroid cells of the class II-selective HDACi APHA9 and pan-HDACi UBHA24. The molecular structure and ID50 of SAHA are reported for comparison. These results are similar to those obtained with the equivalent HDACs purified from other human cell types (Duong et al., 2008; Mai et al., 2003; Mai et al., 2005; Ragno eta al., 2008).
B) Morphology of human proerythroblasts exposed to EPO for 0 or 96 h (4 days) either alone or in the presence of APHA9 and UBHA24. The presence of the HDACi did not affect progression of human erythroblasts to the polychromatophilic state after 4 days of exposure to EPO. The scale bar included in the micrograph corresponds to 35 μM.
C) Real-time RT-PCR determination of the levels of GATA1, GATA2 and HDAC1 mRNA in erythroblasts exposed for 96 h to EPO either alone or in the presence of APHA9 (2 μM), and UBHA24 (0.2 μM). Results are presented as relative units with respect to cells exposed to EPO alone and are presented as mean (±SD) of values observed in three separate experiments. Values statistically different (p<0.05) from controls are indicated by *.

