Figure 10.

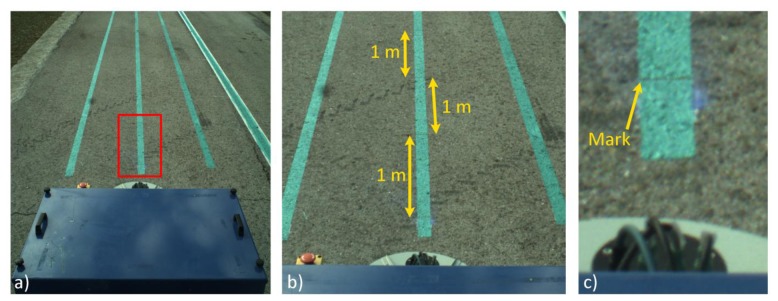
The test conducted for computing the longitudinal error of the vision system. Image acquired and diverse zooms. (a) Original image; (b) 200% zoom; 1 m apart between marks; (c) 800% zoom; mark location: pixel(y) = 1,103.

The test conducted for computing the longitudinal error of the vision system. Image acquired and diverse zooms. (a) Original image; (b) 200% zoom; 1 m apart between marks; (c) 800% zoom; mark location: pixel(y) = 1,103.