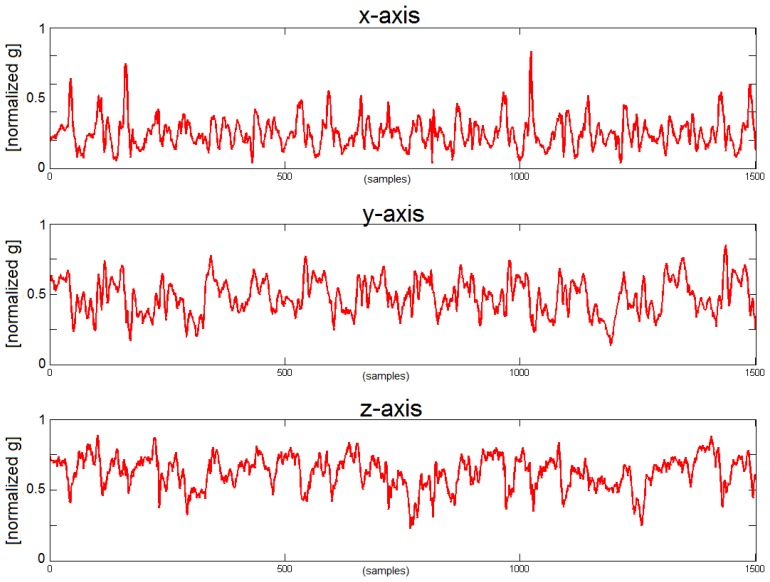
Figure 4.
Signals from the belt sensor in a PD patient. From top to bottom the figure shows the x-axis, y-axis and z-axis. Values on the horizontal axis are samples and vertical axis is directly is the normalized output of the accelerometers [49], the acceleration value of the sensors range from −6 g to +6 g, the vertical axis of the figure shows the values normalized between 0 and 1 by subtracting the minimum (−6 g) and dividing by the range (12 g).

