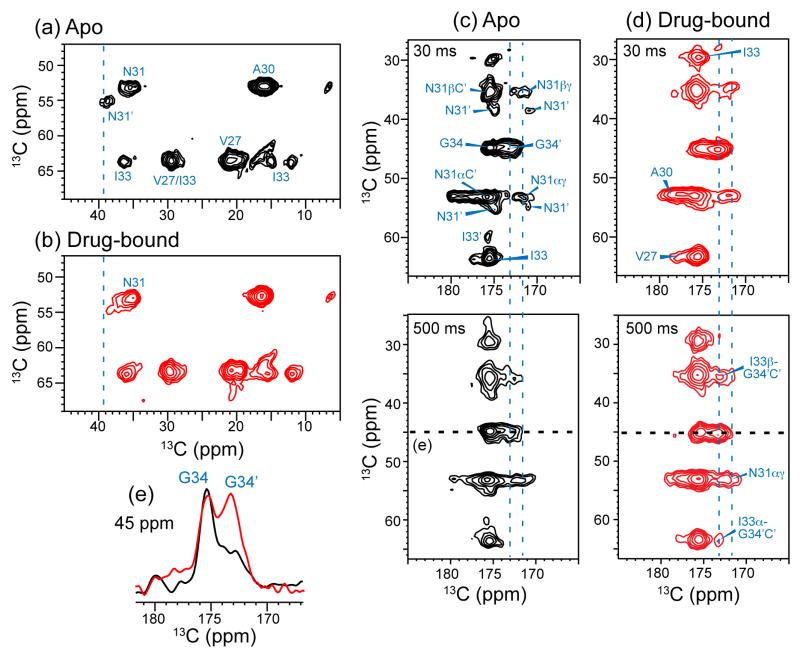
Figure 2.
2D 13C-13C correlation spectra of VANIG19-49, S31N in DMPC bilayers without and with WJ352 at pH 6.5. (a, b) Aliphatic region of the 30 ms spectra of the apo peptide (a) and drug-bound peptide (b). Drug binding changed the conformational equilibrium of the N31 Cα-Cβ peaks. (c, d) Carbonyl region of the 30 ms (top) and 500 ms (bottom) spectra of the (c) apo and (d) drug-bound peptide. N31, I33 and G34 exhibit two sets of chemical shifts. (e) 45-ppm cross section of the apo (black) and drug-bound (red) peptide, showing the G34 Cα-CO cross peak. All spectra were measured at 243 K under 7 kHz MAS.

