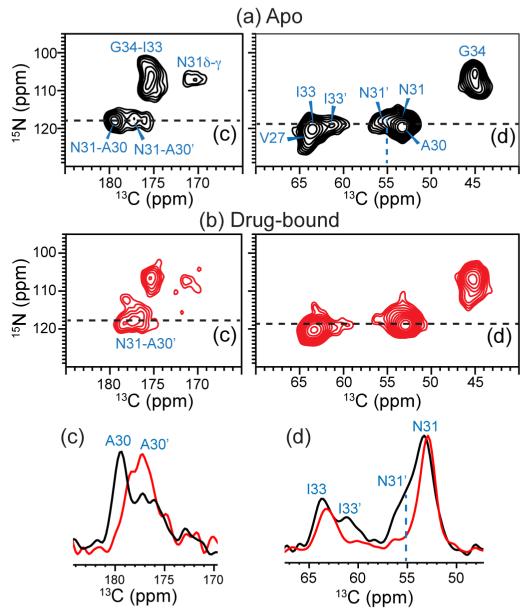
Figure 3.
2D 15N-13C correlation spectra of VANIG19-49, S31N in DMPC bilayers at pH 6.5. (a) Without drug (black). (b) With drug (red) at the 10:1 drug : tetramer ratio. (c) A30 CO cross section at the 15N chemical shift of 117.6 ppm. Drug binding changed the intensity distribution of two A30 CO peaks. (d) I33 and N31 Cα cross section at 119.1 ppm 15N chemical shift. Drug binding selected one of the two peaks of I33 and N31. The spectra were measured at 243 K under 7 kHz MAS.

