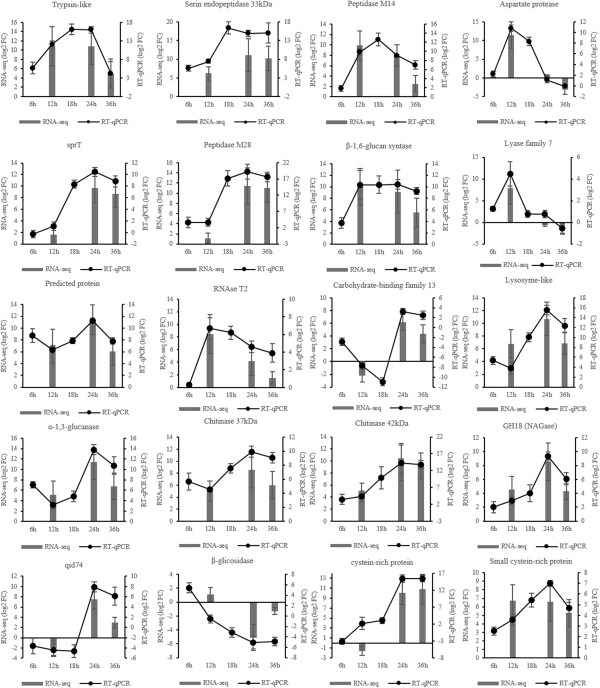
Figure 1.
Comparison of RNA-Seq and real-time RT-PCR analyses. Histograms represent the relative expression levels (log2) (FPKM SSCW/FPKM glucose) as assessed by RNA-seq. Black dotted lines represent expression levels (log2) of the relative expression (SSCW compared to glucose for each time) as assessed by RT-qPCR analysis and reported as means and standard errors of three biological replicates for each treatment.

