Figure 2.

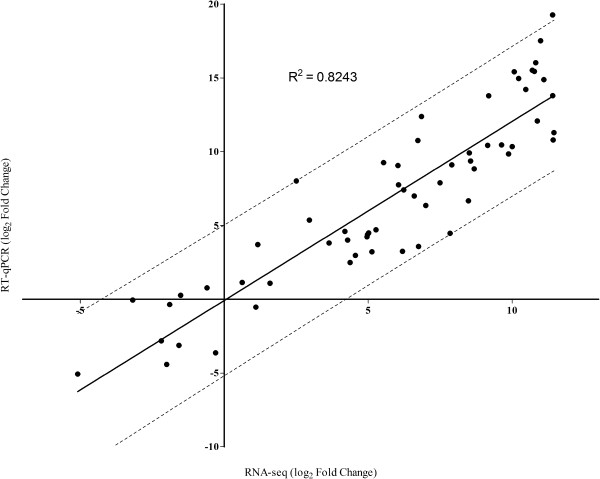
Pearson correlation between the RNA-seq and RT-qPCR data. All expression data were normalized in log2.--- Represents the 95% confidence interval.

Pearson correlation between the RNA-seq and RT-qPCR data. All expression data were normalized in log2.--- Represents the 95% confidence interval.