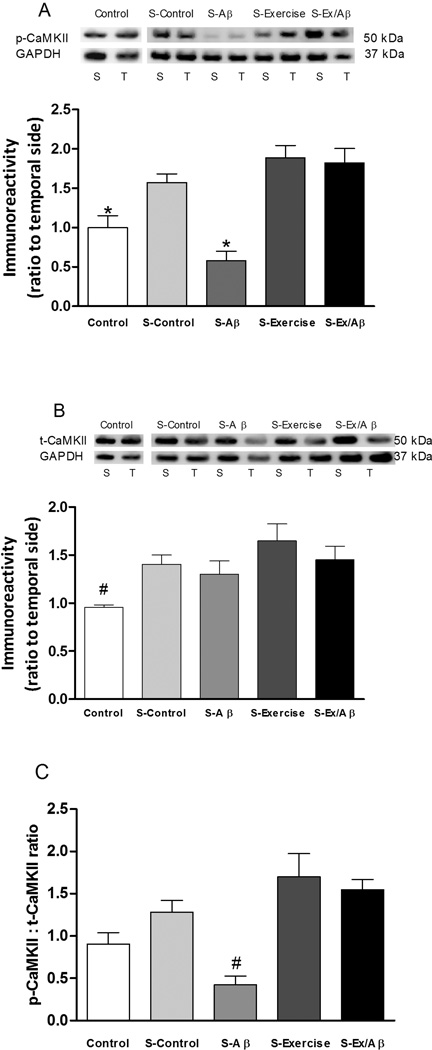
Figure 3.
Levels of phosphorylated (p)-CaMKII (A), total (t)-CaMKII (B), and the p-CaMKII:t-CaMKII ratio (C) in area CA1 after E-LTP induction. S: septal portion, T: temporal portion of CA1 area. Compared to the unstimulated control group, HFS increased the level of p-CaMKII in all groups except the Aβ rats and significantly increased the levels of t-CaMKII in all groups. Thus, after HFS, the pCaMKII : t-CaMKII ratio was significantly lowered in Aβ rats compared to all other groups including unstimulated control rats. Regular exercise prevented AD-induced reduction in p-CaMKII level. (*) indicates statistically different from stimulated (S)-Control, S-Exercise, and S-Ex/Aβ, p= 0.001–0.05. (#) indicates significantly different from all other groups, p = 0.01–0.05. Values are mean ± S.E.M., n = 4–6 rats/group. Insets are representative western blots.

