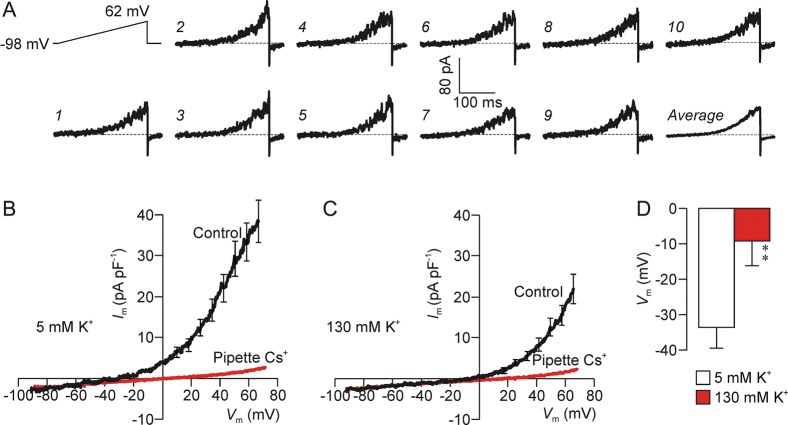
Figure 1.
K+ currents in human spermatozoa. (A) Raw experimental traces showing the membrane currents evoked by a series of depolarizing voltage ramps (top left) that were imposed at 1 Hz. To analyse the results of such experiments, the currents evoked by successive depolarizations were pooled in order to obtain an average response for each spermatozoon (bottom right). (B) Im–Vm relationships quantified under standard conditions (n = 12) and using Cs+-based pipette solution (n = 8). (C) Currents recorded from the same cells after 20–30 s exposure to K+-rich bath solution. (D) Values of resting Vm estimated by regression analysis (see Materials and Methods) of data recorded using the standard pipette filling solution and during to standard (5 mM K+) and K+-rich (130 mM K+) bath solutions. All data shown as mean ± s.e.m.

