
Figure 11.
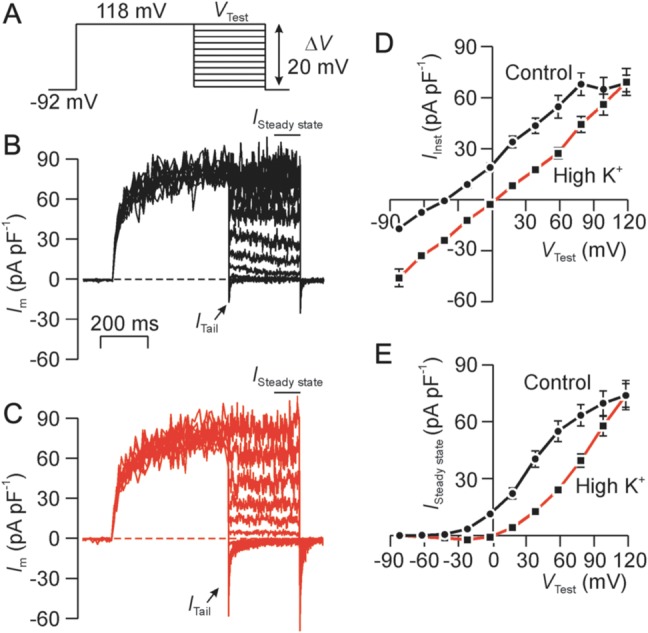
Conductive properties of the ion channels that underlie the transient tail current (ITail). (A) Voltage pulse protocol used in all experiments. (B) Typical record showing currents recorded under standard conditions ITail was quantified immediately after Vm was stepped to VTest, whilst the steady-state current (ISteady state) was quantified as the mean current recorded over the final few ms of the test pulse. (C) Data subsequently recorded after 20–30 s exposure to K+-rich bath solution. (D) Plots showing the ITail–Vm relationship quantified during exposure to standard bath solution (Control) and after 20–30 s exposure to K+-rich bath solution (High K+). (E) Plots showing the ISteady state–Vm relationship quantified during exposure to standard bath solution (Control) and after 20–30 s exposure to K+-rich bath solution (High K+). All data are mean ± s.e.m. (n = 5).