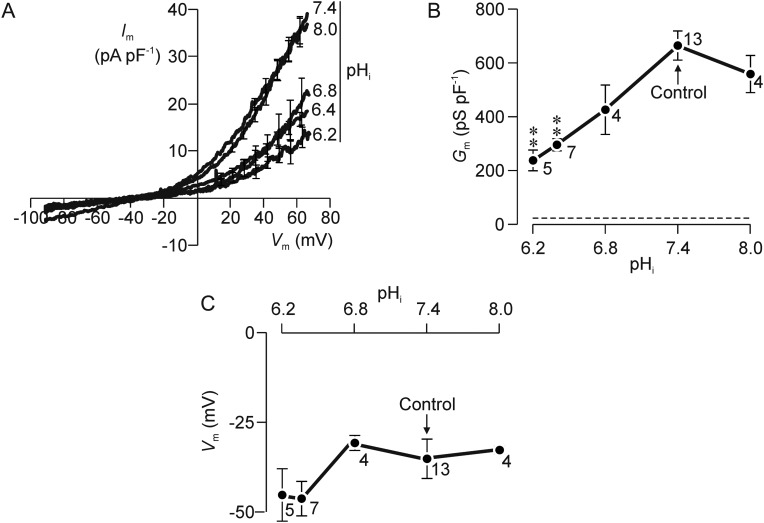
Figure 2.
Effects of altering internal pH (pHi). (A) Im–Vm relationships quantified using pipette filling solutions that had been adjusted to a pH value ranging from 6.2 to 8.0. (B) The values of Gm derived by regression analysis of currents flowing at positive potentials are plotted against pHi; the dashed line shows the value of Gm quantified using Cs+-rich pipette solution. (C) Values of resting Vm estimated by quantifying the reversal potential are plotted against pHi. All data are mean ± s.e.m. and values of n are shown besides each point; asterisks denote data that differed significantly (P < 0.01, one way ANOVA/Dunnet's post hoc test) from the value of Gm quantified at pHi 7.4.

