Figure 3.
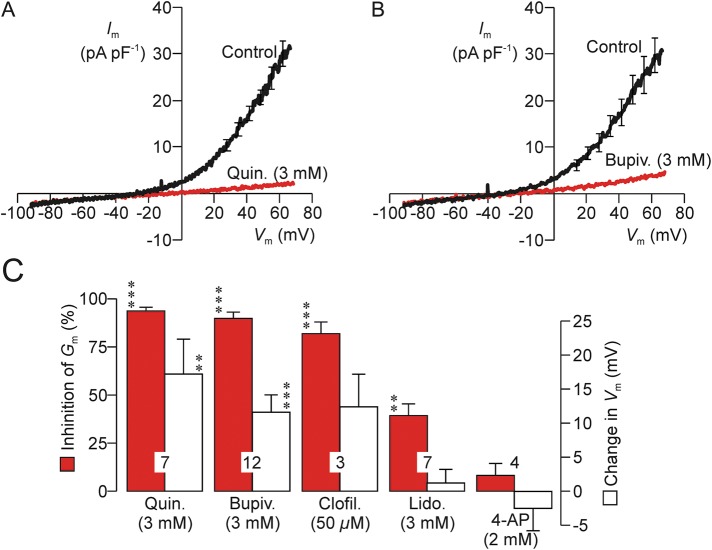
Effects of compounds that block K+ channels. (A) Im–Vm relationships quantified both under control conditions and after 20–30 s exposure to 3 mM quinidine (n = 7). (B) Results of experiments that used an identical protocol to explore the effects of 3 mM bupivacaine. (C) Data from experiments that explored the effects of putative K+ channel blockers were analysed by calculating (i) the change in Gm (% of control) induced by each test substance (filled columns), and (ii) the changes in resting Vm (i.e. the observed shift in reversal potential) induced by each test substance. Data are mean ± s.e.m. and n values are shown in each pair of columns. Asterisks denote statistically significant deviations from the respective control values (***P < 0.001, ** P < 0.01, Student's paired t-test).

