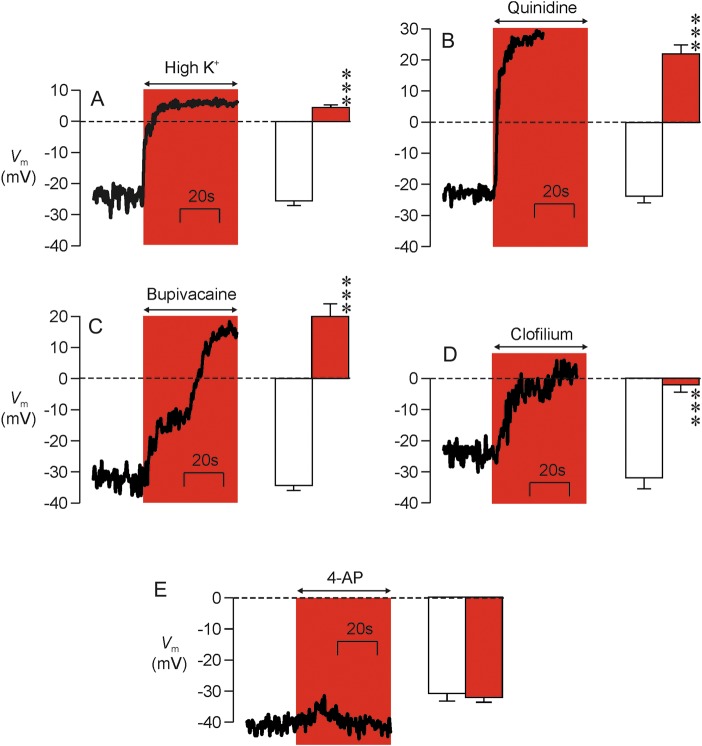
Figure 4.
Direct measurement of Vm. The left-hand part of each panel shows a continuous recording from a single cell that illustrates the effects of (A) K+-rich bath solution (n = 3), (B) 0.3 mM quinidine (n = 7), (C) 3 mM bupivacaine (n = 5), (D) 50 µM clofilium (n = 5) and (E) 2 mM 4-AP (n = 10) upon the zero current potential, which provides a read out of Vm. The right-hand section in each panel; shows the pooled data (mean ± s.e.m) derived from the entire series of experiments. Asterisks denote statistical significant differences between the control and experimental data (P < 0.001, Student's paired t-test).

