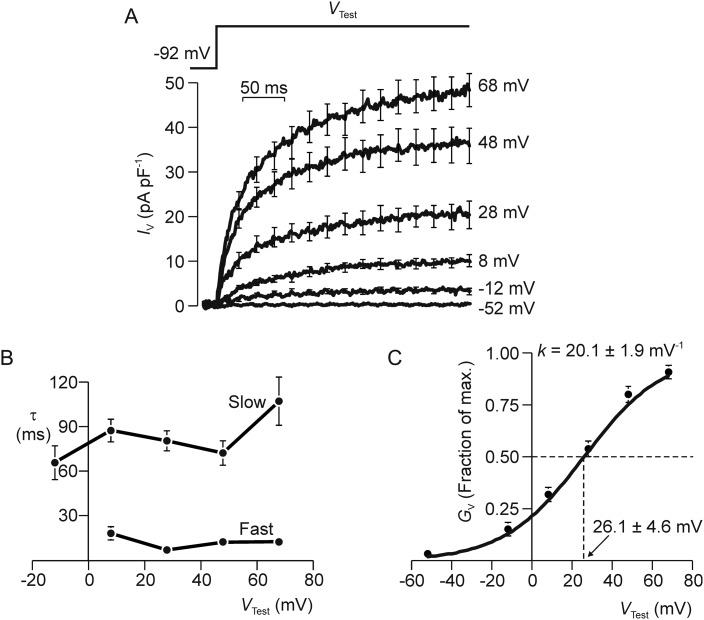
Figure 5.
Kinetics of current activation. (A) Membrane currents (n = 7–16) evoked by maintained voltage steps to a series of test potentials (VTest). (B) The responses to step depolarization consistently followed time courses that were very accurately modelled as the sum of two exponential processes. The time constants (τ) for the fast and slow components of this response were calculated by non-linear regression and plotted against VTest. All data are mean ± s.e.m. and leak/capacitative currents were subtracted on line in order to isolate the voltage-induced component of the total membrane current (IV). (C) Steady-state values of IV were quantified over the final 50 ms of each voltage step, and used to quantify the voltage-induced increase in membrane conductance (GV); the results of this analysis are plotted against VTest and the solid line shows a solution to the Boltzmann Equation fitted to these data by non-linear regression. The Boltzmann constant (κB) and the voltage required for half-maximal activation (V50) are presented.

