
Figure 6.
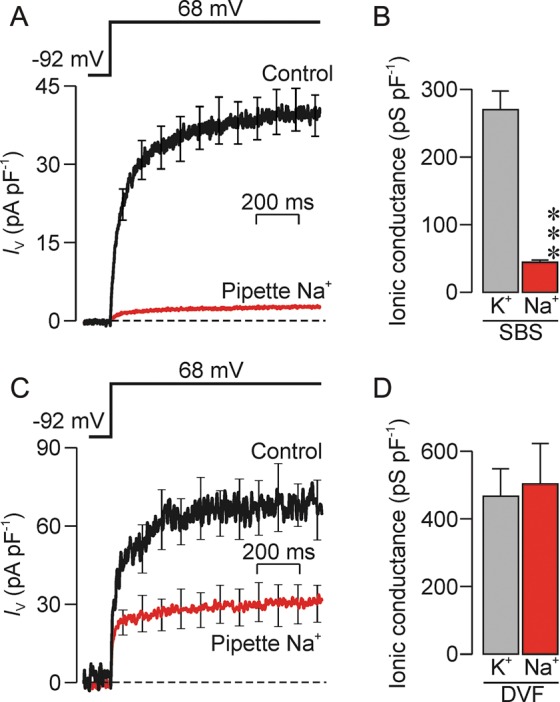
Ionic selectivity of the voltage-induced conductance. (A) Currents evoked by step depolarization to 68 mV were quantified both under control conditions (n = 18) and using Na+-rich pipette solution (n = 38) in cells exposed to the standard bath solution (SBS). (B) K+ and Na+ conductances quantified by analysis of data in (A). (C) Currents evoked using an identical voltage pulse that were subsequently recorded from the spermatozoa that were stable enough (standard pipette solution, n = 3; Na+-based pipette solution, n = 5) to allow the standard bath solution to be exchanged for a bath solution devoid of divalent cations (DVF). (D) K+ and Na+ conductances quantified by analysis of data in (C). All data are mean ± s.e.m, asterisks denote statistically significant effect of replacing pipette K+ with Na+ (***P < 0.001, Student's t-test).