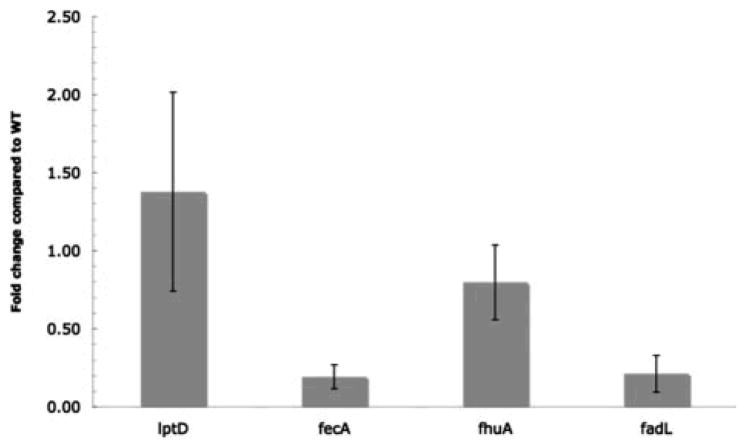
Figure 2. The mRNA levels of FadL and FecA, but not FhuA and LptD, are decreased.
The mRNA levels of FadL, FecA, FhuA and LptD were compared in wild-type and surA strains by RT-qPCR. For comparative and quantitative analysis, transcript levels were normalized to the level of gapA (glyceraldehyde 3-phosphate dehydrogenase A).

