Figure 1.

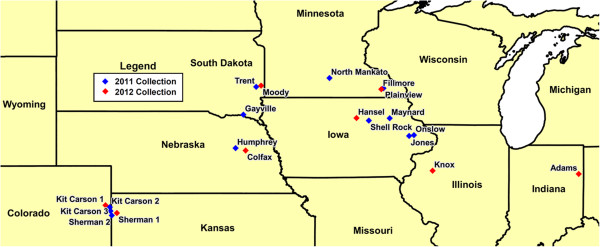
Map of WCR field locations. Collection locations are given for the 20 field collected populations used in this study. 2011 collections are marked in blue, while 2012 collections are marked in red.

Map of WCR field locations. Collection locations are given for the 20 field collected populations used in this study. 2011 collections are marked in blue, while 2012 collections are marked in red.