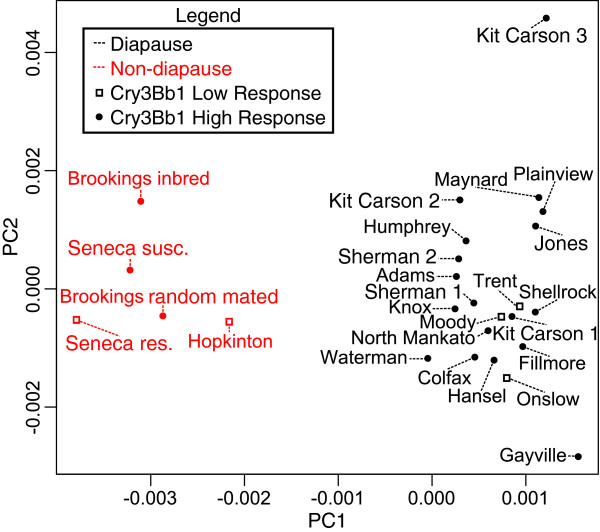
Figure 5.

Principal coordinate analysis using genetic distances between 26 WCR populations. Diapause populations are colored in black and non-diapause population are red. Populations with a reduced response to Cry3Bb1 are denoted with open squares, while populations with unknown or low to intermediate resistance are denoted with filled circles.
