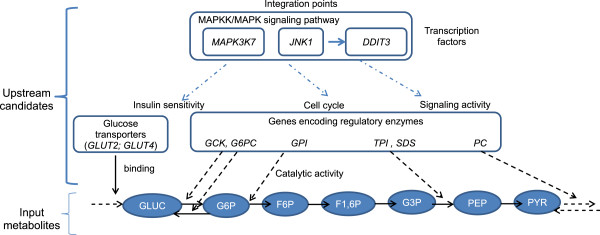
Figure 2.

Finding upstream regulators of various metabolites. This scheme illustrates how an input list of metabolites and the output list of regulatory candidates at the enzymatic and molecular levels were positioned together. A list of 7 metabolites participating in glycolysis (GLUC: glucose; G6P: glucose-6-phosphate; F6P: fructose-6-phosphate; F-1,6P: fructose 1,6 diphosphate; G3P: glyceraldehyde-3 phosphate; PEP: phosphoenolpyruvate; PYR: puryvate) were submitted as input (i.e., molecules for which common or specific upstream regulators should be identified). All these metabolites were supposed to be increasingly abundant in response to an unknown external factor. Regulated reactions in which these metabolites were involved and their neighbor molecules (up to 3 levels of neighboring) were extracted from an encyclopedic database on mammalian signaling pathways and converted into a causality graph. The proposed candidates included transporters (glucose binding; GLUT2/SLC2A2 and GLUT4/SLC2A4), catalytic enzymes (GCK: glucokinase; GPI: glucose-6 phopshate isomerase; TPI: triose phosphate isomerase; PC: pyruvate carboxylase; G6PC: glucose-6 phosphate carboxylase; SDS: serine dehydratase) and integrative actors (MAP3K7; MAPK8/JNK1) in glucose homeostasis and insulin signaling.
