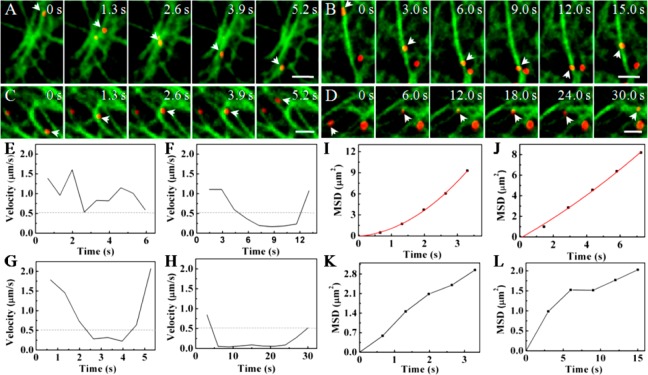
Figure 2.
Influenza viruses moving along different configurations of microtubules. (A) Snapshots of a virus moving unidirectionally along microtubules (Scale bar: 2 μm). (B) Snapshots of a virus decelerating near an intersection of microtubules and moving back along the same microtubule (Scale bar: 2 μm). (C) Snapshots of a virus decelerating near an intersection of microtubules and moving along the same microtubule sequentially (Scale bar: 2 μm). (D) Snapshots of a virus decelerating near an intersection of microtubules and moving along another microtubule sequentially (Scale bar: 2 μm). (E–H) Velocity vs time plots of the movements shown in A–D, respectively. The dotted lines indicate the velocity of 0.5 μm/s. (I–L) MSD vs time plots of the movements shown in A–D, respectively. The red lines are the fits to MSD = 4Dτ + (Vτ)2 + constant (D and V are the diffusion coefficient and mean speed of the particle, the constant term was due to noise), and the black lines indicate the plots cannot be fitted due to the abnormalities of the movements.

