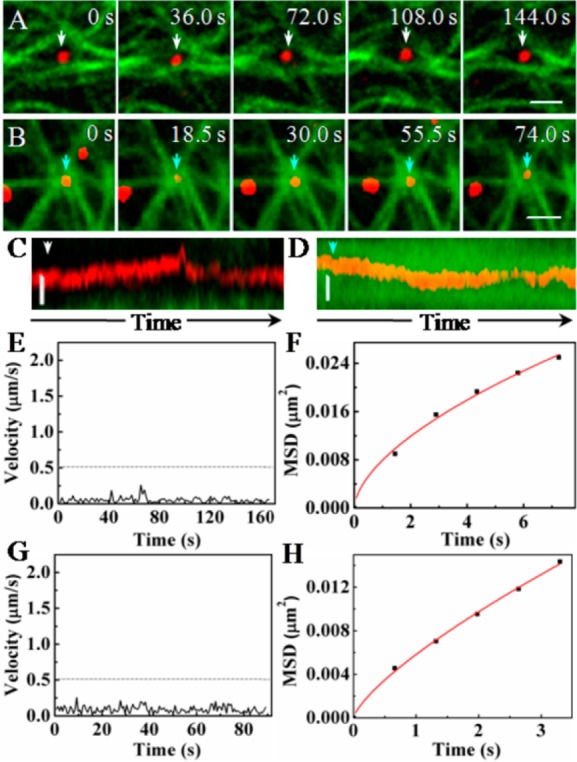
Figure 3.

Influenza viruses moving at two typical configurations formed by several microtubules. (A) Snapshots of a virus being confined by a grid formed by microtubules (Scale bar: 2 μm). (B) Snapshots of a virus being confined by an intersection of microtubules (Scale bar: 2 μm). (C, D) Kymograph images of the movements of the viruses shown in A and B, respectively (Scale bar: 0.5 μm). (E, G) Velocity vs time plots of the movements shown in A and B, respectively. The dotted lines indicate the velocity of 0.5 μm/s. (F, H) MSD vs time plots of the movements shown in A and B, respectively. The red lines are the fits to MSD = 4Dτα (α is a coefficient and α < 1).
