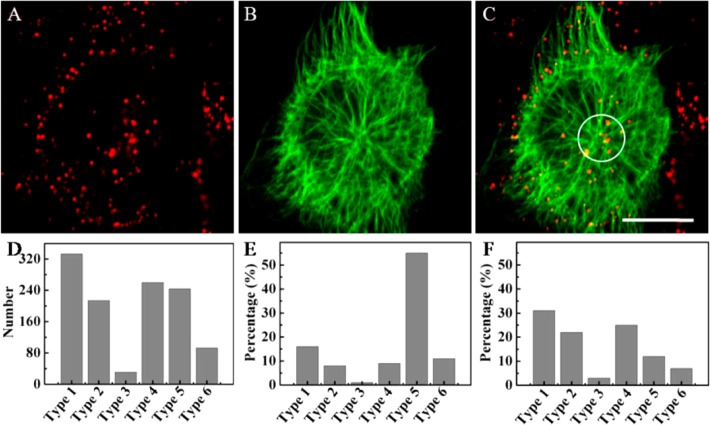
Figure 4.
Tracking the movements of viruses in the bottom of the cells. (A–C) Fluorescence images of QDs-labeled viruses (red), Dylight 649-labeled microtubules (green), and the overlapped image of panels A and B (Scale bar: 20 μm). (D–F) Distributions of six types of the movements in the whole cells, near the Microtubule organizing center (MTOC), and in the region from the cell periphery to the MTOC region, respectively.

