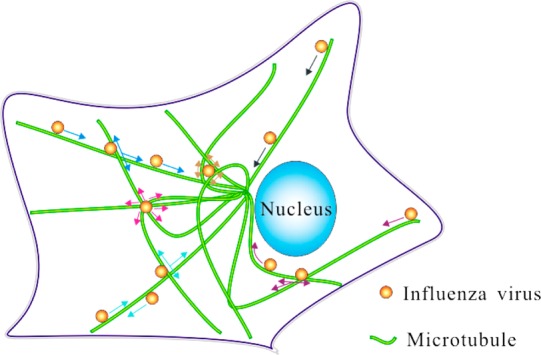
Figure 6.

Schematic diagram of the microtubule-related behaviors of viruses. The black arrow indicates that the virus is moving unidirectionally along microtubules (Type 1). The light blue arrow indicates the virus is decelerating near an intersection of microtubules and moving back along the same microtubule (Type 2). The blue arrow indicates that the virus is decelerating near an intersection of microtubules and moving along the same microtubule sequentially (Type 3). The purple arrow indicates that the virus is decelerating near an intersection of microtubules and moving along another microtubule sequentially (Type 4). The yellow arrow indicates that the virus is moving confinedly in a grid formed by microtubules (Type 5). The pink arrow indicates that the virus is moving confinedly at an intersection of microtubules (Type 6).
