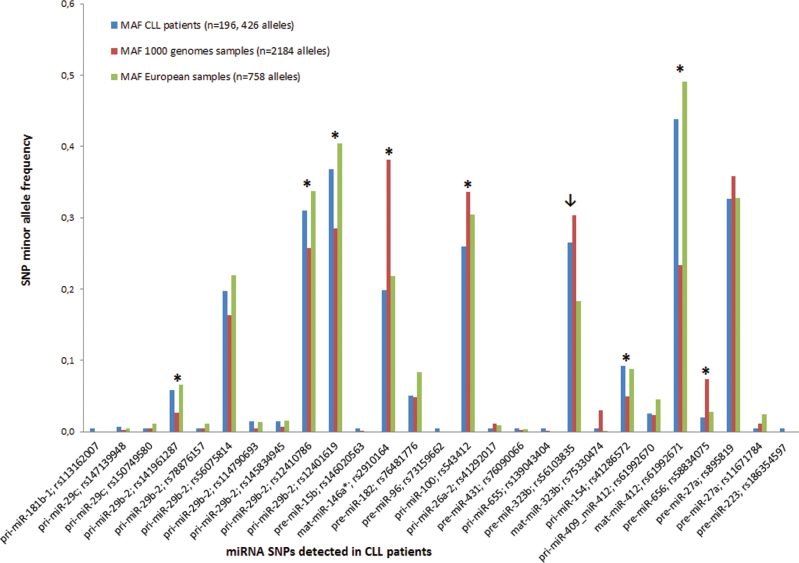
Fig. 2.
Frequency of minor alleles in CLL patients versus control population from the 1000 genomes project. The allelic frequencies of SNPs detected in miRNAs in CLL patients differed significantly (P < 0.05) between CLL patients and all 1000 genomes project samples in eight SNPs marked with asterisk, and in one SNP (marked with arrow) when a separate European population was analyzed.
MAF represents minor allele frequency of detected SNPs. Blue columns represent SNP–MAF of CLL patients, red columns represent SNP–MAF of all samples from the 1000 genomes project and green columns represent SNP–MAF of European samples from the 1000 genomes project.

