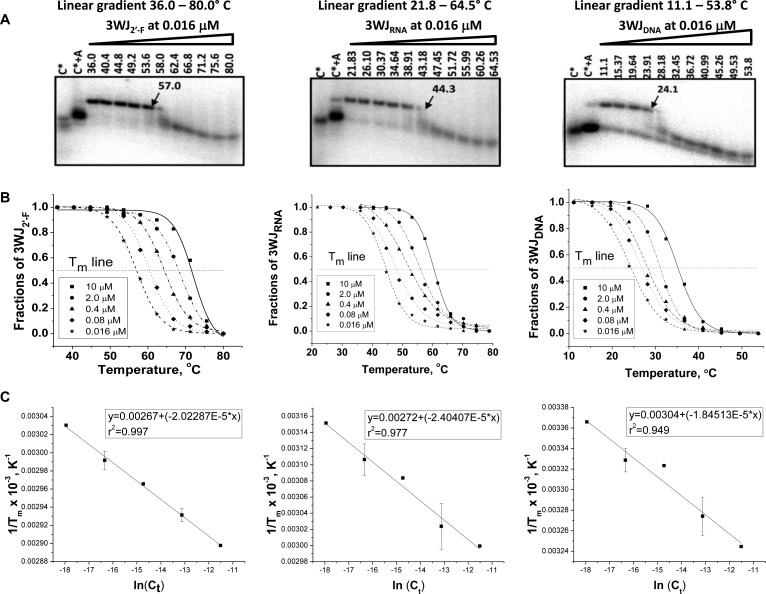
Figure 6.
Calculation of thermodynamic parameter for 3WJs formation. (A) Representation of native 15% TGGE for the 3WJ complexes at the lowest concentration (0.016 μM in each lane). The radiolabeled C strand of corresponding 3WJ complexes indicated with asterisk “*”. Lanes 3WJc* and 3WJc*+3WJa served as controls for monomer and dimer location. (B) Melting temperature profiles of RNA, 2′-F RNA, and DNA 3WJs obtained after quantification of the corresponding band from the perpendicular TGGE at various concentrations. (C) Plots of Tm versus 3WJ concentrations (van’t Hoff analysis) evaluated from melting curves of the 3WJ complexes obtained at different strand concentrations.

