
Figure 2.
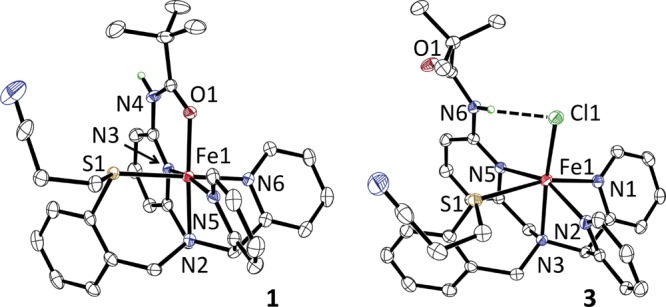
Displacement ellipsoid plots (50% probability level) of the dication of 1 (left) and the cation of 3 (right). H-atoms omitted for clarity, except for the amide N–H.
Official websites use .gov
A
.gov website belongs to an official
government organization in the United States.
Secure .gov websites use HTTPS
A lock (
) or https:// means you've safely
connected to the .gov website. Share sensitive
information only on official, secure websites.
Displacement ellipsoid plots (50% probability level) of the dication of 1 (left) and the cation of 3 (right). H-atoms omitted for clarity, except for the amide N–H.