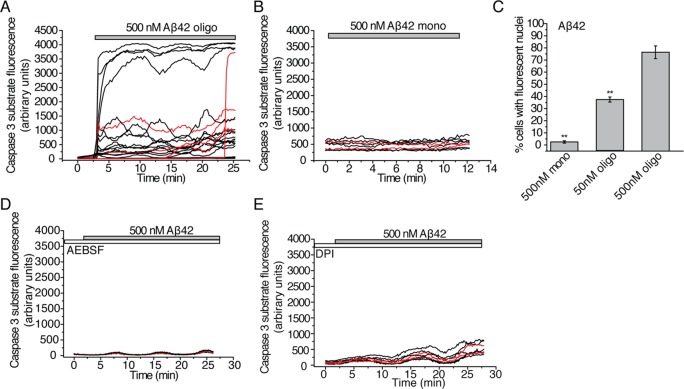
Figure 4.
Effects of Aβ oligomers on the activation of caspase-3. The NucView488 substrate used to monitor the activation of caspase-3 in real time becomes fluorescent when cleaved by caspase-3 and subsequently migrates to the nucleus. The kinetics of caspase-3 activation were, therefore, monitored by measuring the fluorescence within each cell as a function of time. In the kinetic traces shown here, each line represents a single cell with data for neurons in red and for astrocytes in black. Additionally, end point measurements of net caspase-3 activation after 30 min of observation were taken by counting the number of cells observed with fluorescent nuclei as a fraction of total cells observed. The experiments were performed on at least 4 different samples. (A) Fluorescence of the NucView488 caspase-3 substrate as a function of time following treatment of primary cultures containing both neurons and astrocytes with 500 nM Aβ42 (containing 19.5 nM oligomers); 370 cells were monitored over 6 samples. (B) Fluorescence of the NucView488 caspase-3 substrate as a function of time following the treatment of primary cultures containing both neurons and astrocytes with 500 nM of monomeric Aβ42; 187 cells were monitored over 4 samples. (C) Proportion of cells (%) that experience activation of caspase-3 following 30 min of incubation with monomeric Aβ42 (500 nM) or oligomeric Aβ42 solutions (total peptide concentrations of 50 nM and 500 nM with oligomer concentrations of 1.95 nM and 19.5 nM). These data are the end points (after 30 min) of experiments presented in A and B. For experiments using 50 nM of Aβ42, 231 cells were monitored over 4 different samples. ** signifies a p-value <0.01 by a Mann–Whitney nonparametric rank correlation. Comparisons were performed relative to the data obtained with 500 nM of Aβ42 oligomers. (D) Fluorescence of the NucView488 caspase-3 substrate as a function of time following the treatment of primary hippocampal cultures containing both neurons and astrocytes with 500 nM Aβ42 (containing 19.5 nM oligomers). Cultures in this experiment had been pretreated with the NADPH-oxidase inhibitor, AEBSF (20 μM), for 30 min prior to the addition of Aβ42; 154 cells were monitored in a single sample. (E) Fluorescence of the NucView488 caspase-3 substrate as a function of time following the treatment of primary hippocampal cultures containing both neurons and astrocytes with 500 nM Aβ42 (containing 19.5 nM oligomers). The cultures in this experiment had been pretreated with the NADPH-oxidase inhibitor, DPI (0.5 μM), for 30 min prior to the addition of Aβ42; 138 cells were monitored on a single sample. Control experiments to verify that the observed effects on caspase-3 activation are not affected by the fluorophores attached to the Aβ peptides are reported in Figure S2E,F, Supporting Information.

