
Figure 3.
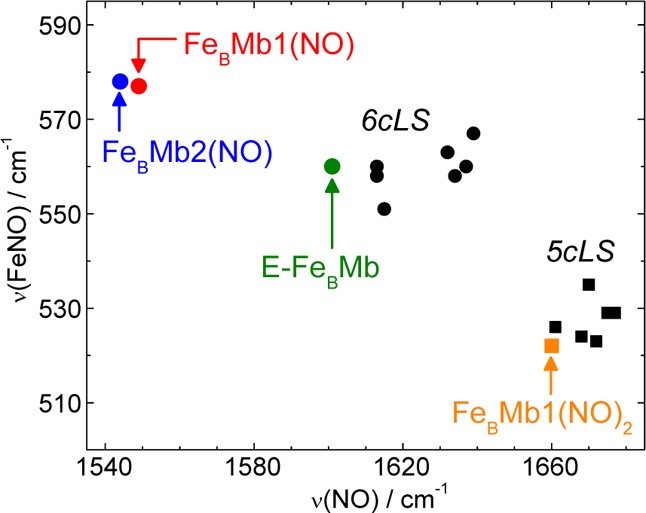
ν(FeNO) vs ν(NO) plot of 5cLS and 6cLS heme {FeNO}7 complexes and proteins (see Table 1 for frequencies and references).
Official websites use .gov
A
.gov website belongs to an official
government organization in the United States.
Secure .gov websites use HTTPS
A lock (
) or https:// means you've safely
connected to the .gov website. Share sensitive
information only on official, secure websites.
ν(FeNO) vs ν(NO) plot of 5cLS and 6cLS heme {FeNO}7 complexes and proteins (see Table 1 for frequencies and references).