
Figure 8.
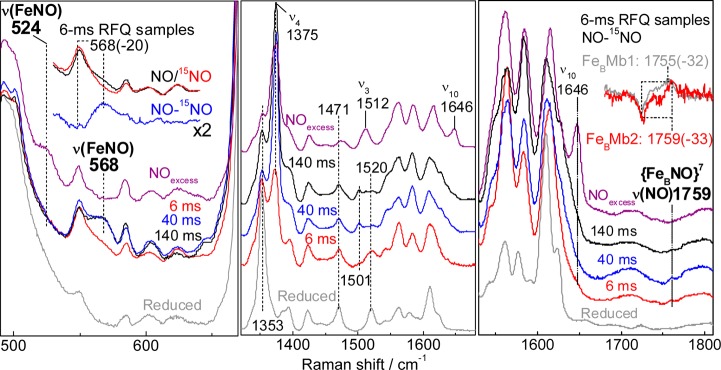
RR spectra of RFQ samples of the reaction of reduced FeBMb2 with excess NO compared to those of resting reduced FeBMb2 (gray traces) and the end product of the reaction (purple traces) (excitation wavelength 406 nm, sample temperature 110 K). Also shown in the upper right inset is an overlay of the 14NO – 15NO differential signal for the nonheme ν(NO) modes in the 6-ms RFQ samples of FeBMb1 (gray) and FeBMb2 (red).