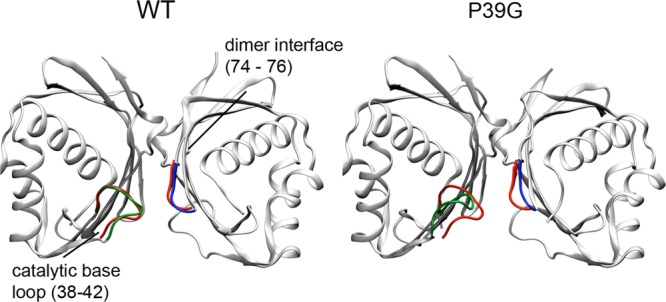
Figure 10.

Ribbon diagrams of the average structure of WT KSI (left) and the P39G mutant (right), both colored gray, highlighting the conformational changes in the catalytic base loop residues (38–43, green) and the proximal residues across the dimeric interface (74–76, blue). The backbone structures of these two regions in the D38N-equilenin crystal structure (PDB entry 1QJG) are colored red for reference. Structures were aligned by minimization of the rmsd of the Cα atoms in the dimer.
