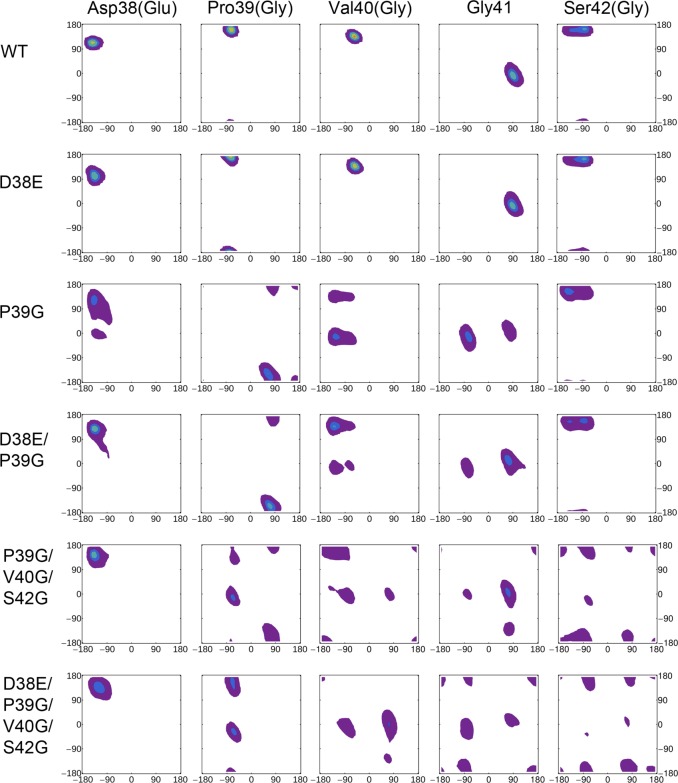
Figure 8.
Ramachandran plots of the catalytic base loop residues Asp38(Glu), Pro39(Gly), Val40(Gly), Gly41, and Ser42(Gly) obtained from MD trajectories by calculating the probability distribution function averaged over all data sets. The x-axis corresponds to angle φ (degrees), and the y-axis corresponds to angle ψ (degrees). Each row corresponds to the specified mutant, and each column corresponds to the specified residue in the catalytic base loop.

