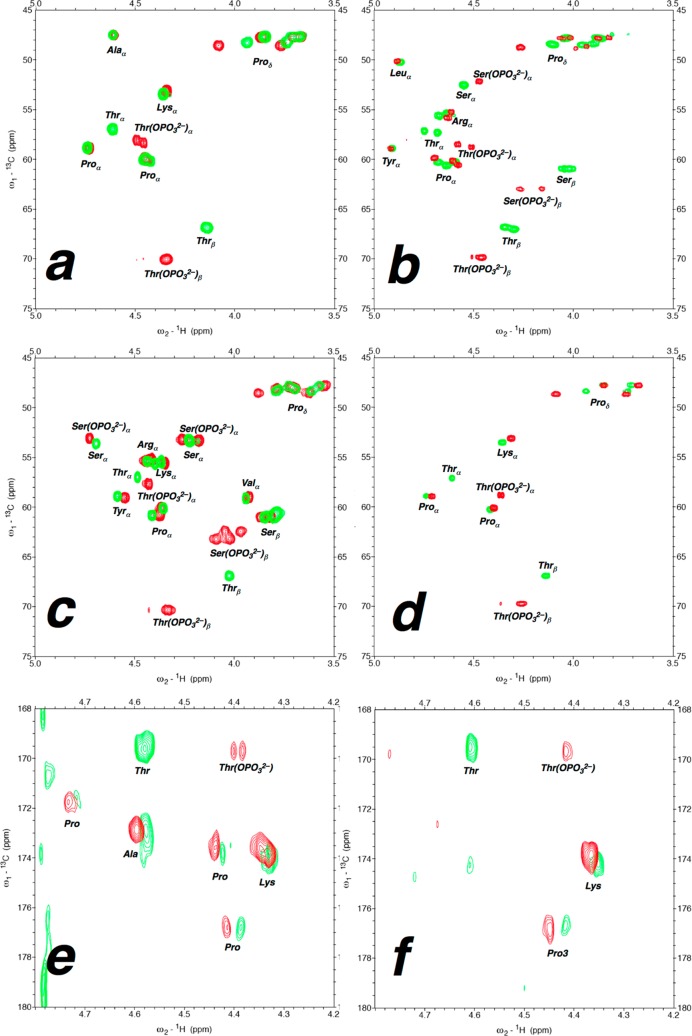
Figure 10.
(a–d) 1H–13C HSQC spectra (Hα–Cα region) of (a) tau174–183, (b) tau211–219, (c) tau229–238, and (d) Ac-KTPP-NH2 peptides. (e,f) 1H–13C HMBC spectra (Hα—C=O region) of (e) tau174–183 and (f) Ac-KTPP-NH2 peptides. Green, peptides with unmodified Ser/Thr; red, peptides with Ser/Thr(OPO32–) (pH 8). Full spectra and tabulated data are in the Supporting Information.

