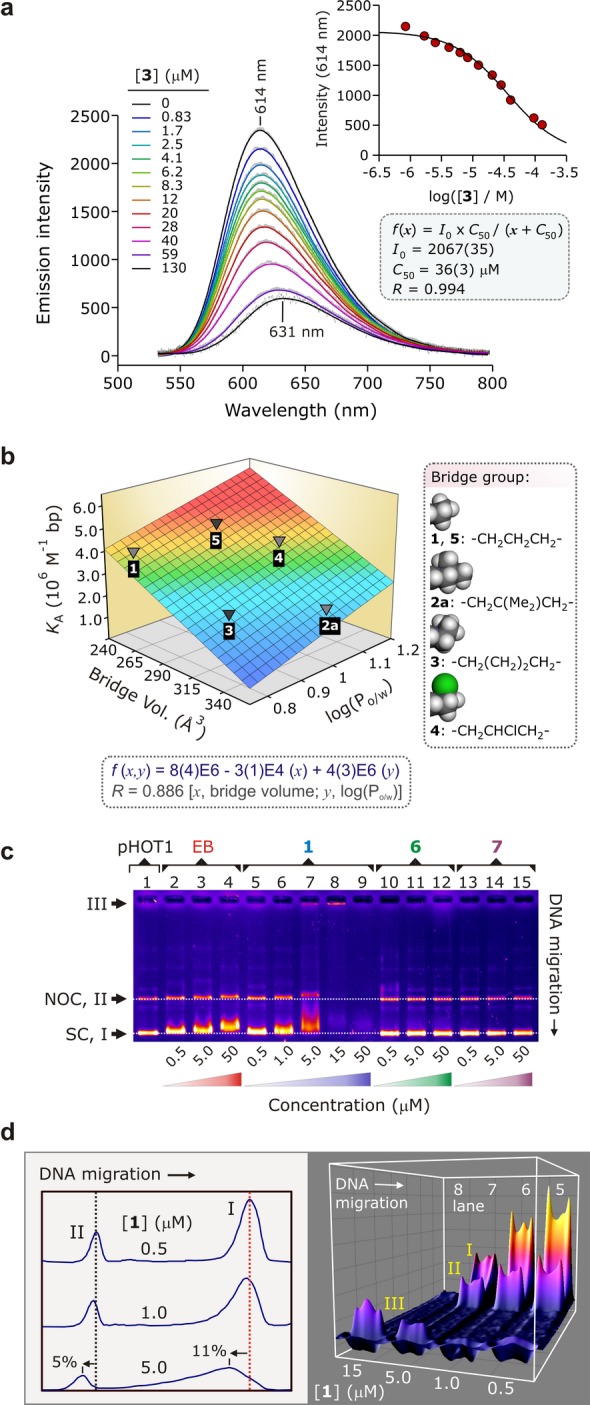
Figure 3.

(a) Displacement of intercalated EB from ctDNA by 3 studied by emission spectroscopy (298 K, pH 7.0, 15% DMSO-TRIS/HCl buffer, 15 μM ctDNA, 15 μM EB). Inset: determination of [3] at 50% loss of EB fluorescence (C50); C50 is used to determine the ctDNA affinity constant, KA, of 3. (b) Graph of KA for 1, 2a, and 3–5 as a function of the steric bulk of the macrocycle’s alkyl bridge and the hydrophobicity of the Au3+ complex, log(Po/w) (Table S3). The surface is the best-fit bivariate linear regression function to the data. (c) EMSA of selected compounds with supercoiled (SC, form I) pHOT1 plasmid DNA (DNA, 31.3 ng/well; TBE buffer, pH 7.8); some nicked-open circular (NOC, form II) DNA is present. The lanes contain pHOT1 plasmid DNA (lane 1), increasing concentrations of EB (lanes 2–4), 1 (lanes 5–9), 6 (lanes 10–12), and 7 (lanes 13–15). The data prove that Au3+ is essential for DNA binding. (d) Two- and three-dimensional deconvolution of the DNA bands in lanes 5–8 of the EMSA gel shown in Part (c).
