
Figure 9.
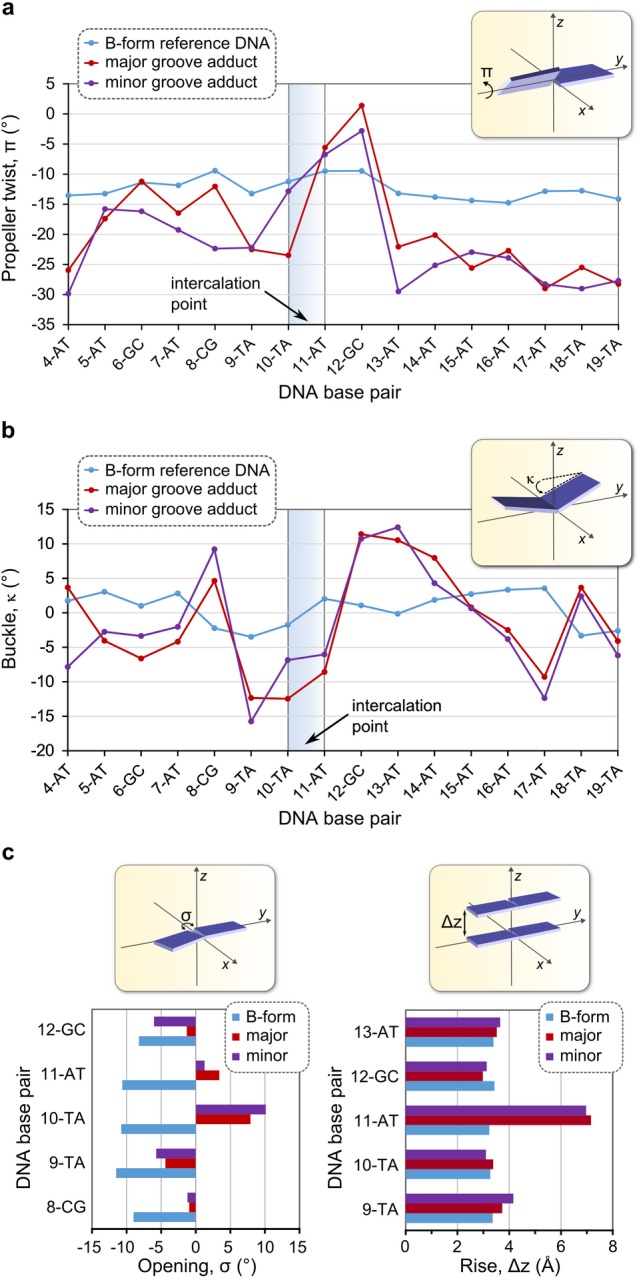
Analysis of key conformational parameters for the two lowest-energy DNA·3 adducts formed by major and minor groove intercalation of the Au3+ macrocycle at the T10-A11 step of the 22-bp duplex depicted in Figure 7. (a) Graph of propeller twist (π) as a function of base pair index for bases 4–19. (b) Graph of buckling angle (κ) as a function of base pair index for bases 4–19. (c) Bar graphs of base-pair opening (σ, left) and rise (Δz, right) for selected base pairs close to the intercalation point.