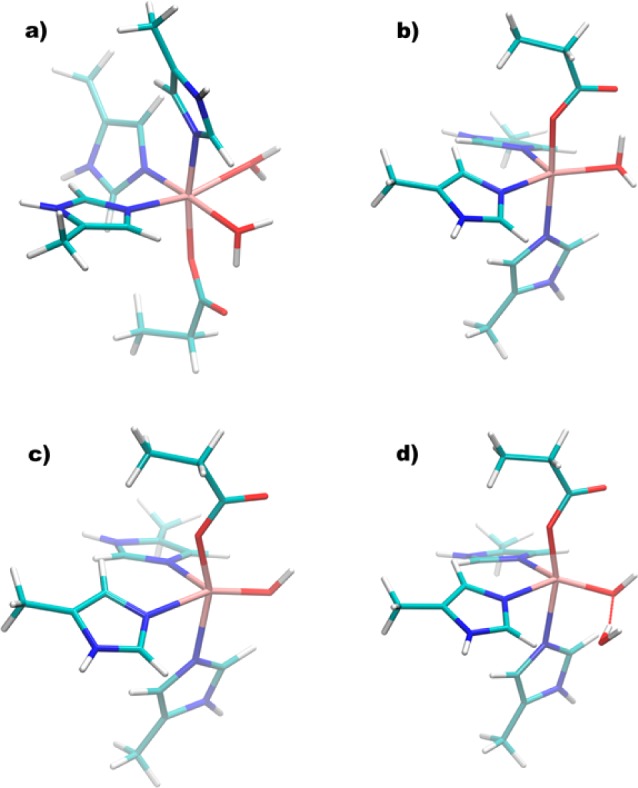
Figure 7.

Cluster models taken from the DFT/MM-optimized structure of WT OxDC that were used to calculate the zfs values of the bound Mn(II) ions in the (a) N-terminal and (b–d) C-terminal domains (see text for details). Color scheme: C, cyan; H, white; N, blue; oxygen, red; Mn, tan.
