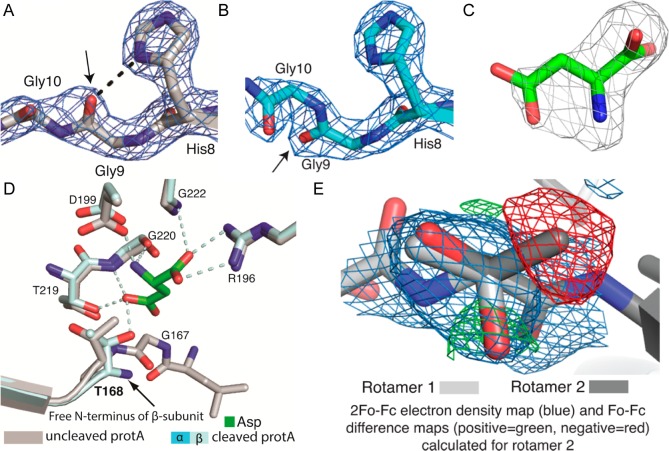
Figure 5.
Comparison of the structures of uncleaved and cleaved guinea pig ASNase3. (A) The conserved HGG loop of uncleaved gpASNAse3 (protomer A) with the 2Fo – Fc electron density map (blue, contour level of 2σ). Enzyme activation via cleavage of the peptide bond between Gly167 and Thr168 is accompanied by a flip in the carbonyl at Gly9 (arrow), which disrupts its interaction (dashed black line) with the imidazole ring of His8. (B) The HGG motif of cleaved gpASNase3 (protomer A) with the carbonyl group (arrow) at Gly9 facing the opposite direction as clearly seen in the 2Fo – Fc electron density map (blue, contour level of 2σ). (C) The Fo – Fc omit map (gray, contoured at +3σ) present in the active site of cleaved gpASNase3 (protomer A). A molecule of Asp is modeled into it. (D) Overlay of uncleaved and cleaved gpASNase3 protomer A showing the active site residues and the ligand Asp (green). In the uncleaved structure, the Asp binding site is occupied by water molecules (not shown). The covalent bond between Gly167 and Thr168 is observed in the uncleaved structure. For cleaved gpASNase3, dashed lines indicate interactions of the Asp ligand with the active site residues. (E) Modeling of the two best fitting rotamers of Thr168 in uncleaved gpASNase3 protomer A. The 2Fo – Fc and Fo – Fc electron density maps shown were calculated for the dark gray rotamer, labeled rotamer 2. Although rotamer 2 partially fits the 2Fo – Fc electron density map (blue, contour level of 1σ), negative electron density (red, contoured at −3σ) surrounds the methyl group, indicating that too many electrons are modeled at that position. There is also positive electron density (green, contoured at +3σ) at the position occupied by the hydroxyl group of rotamer 1, indicating that more electrons should be modeled at that position. This shows that rotamer 1 (light gray) is the correct one.

