
Figure 4.
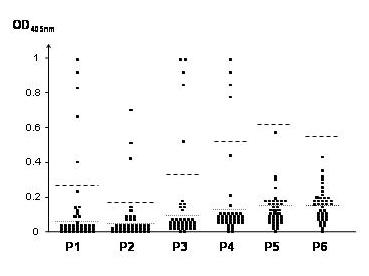
Reactivity of human antigiantin positive sera against six overlapping giantin fragments. A total of 40 antigiantin positive sera were analyzed by ELISA. Black squares represent optical density (OD) values for each individual serum. Dotted lines represent cutoff values for the low-positive group (between the mean OD of normal sera plus 3–15 standard deviations [SDs]), and dashed lines represent cutoff values for the high-positive group (greater than mean OD of normal sera +15 SDs).