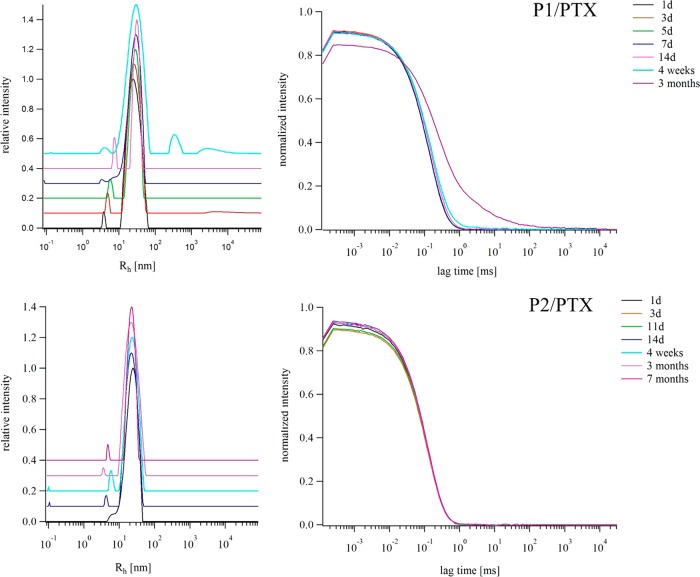
Figure 5.
Long-term stability study for P1/PTX and P2/PTX formulations at maximum loading conditions as determined by DLS at indicated lengths of storage time. Development of the unweighted size distribution of Rh of P1/PTX (10/1.7 g/L, above) and P2/PTX (10/9.9 g/L, below) and their corresponding intensity autocorrelation functions (right) over time. For better visibility only selected size distributions are shown with a y-offset of 0.1.

