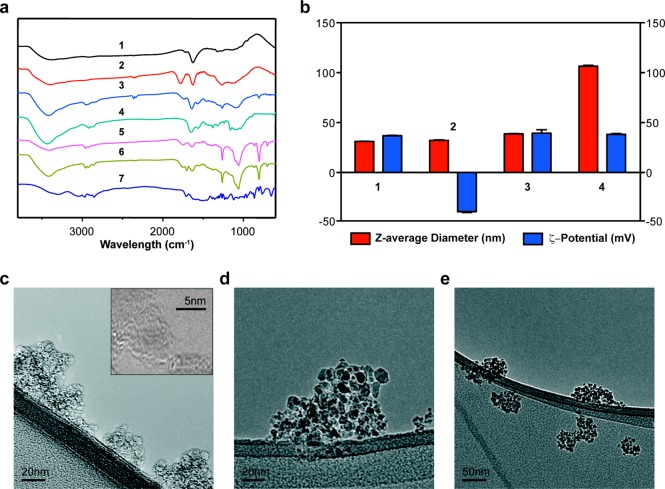
Figure 2.
Characterization of ND-nanogel during synthesis. (a) FT-IR spectra of (1) pristine ND, (2) oxidized ND, (3) ND-PEI, (4) N-acetylated chitosan, (5) ND-nanogel, (6) timolol [TM]-loaded ND-nanogel, and (7) timolol. (b) Particle size (red-colored bars) and ζ-potential (blue-colored bars) distributions of (1) pristine ND, (2) oxidized ND, (3) ND-PEI, and (4) TM-loaded ND-nanogel. TEM images of (c) pristine ND, (d) ND-PEI, and (e) TM-loaded ND-nanogel.

