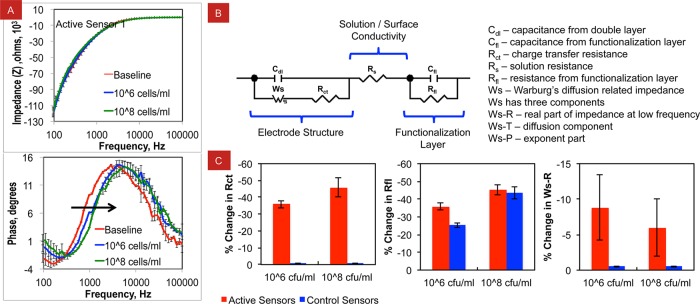
Figure 5.

(A) Example impedance spectra on active sensors before (baseline) and after exposure to 106 or 108 cells/mL of E. coliO157:H7 cells. (B) Modified Randles circuit that best fits our impedance results. (C) Significant changes observed in charge transfer resistance (Rdl, Rfl, and Ws1-R) upon binding of bacterial cells to the sensor surface.
