Figure 2.
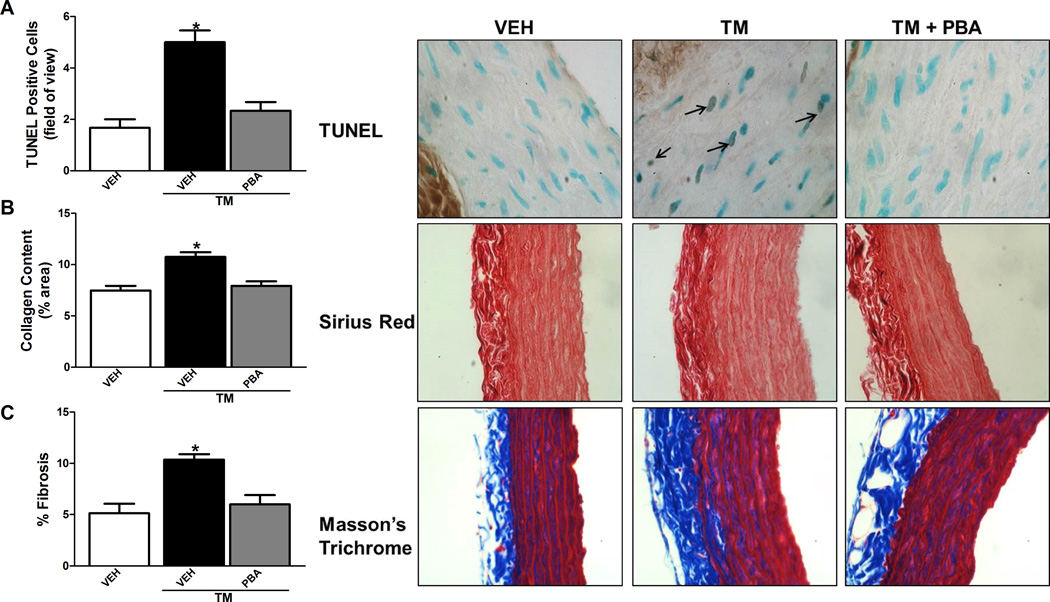
Induction of ER stress increased TUNEL positive nuclei, collagen content and fibrosis in the aorta. A, Top, representative TUNEL staining of aortic sections (100× magnification). Bottom, analysis of positive TUNEL stained cells per field of view. B, Top, representative Sirius Red staining of aortic sections (40× magnification). Bottom, analysis of % Sirius Red stain per total area. C, Top, representative Masson’s Trichrome staining of aortic sections (40× magnification). Bottom, analysis of % Masson’s Trichrome stain per total area. *p < 0.05 versus Vehicle-treated rats. n= 4–10.

